

HBD&D
Grokking human biodiversity with a D20 system

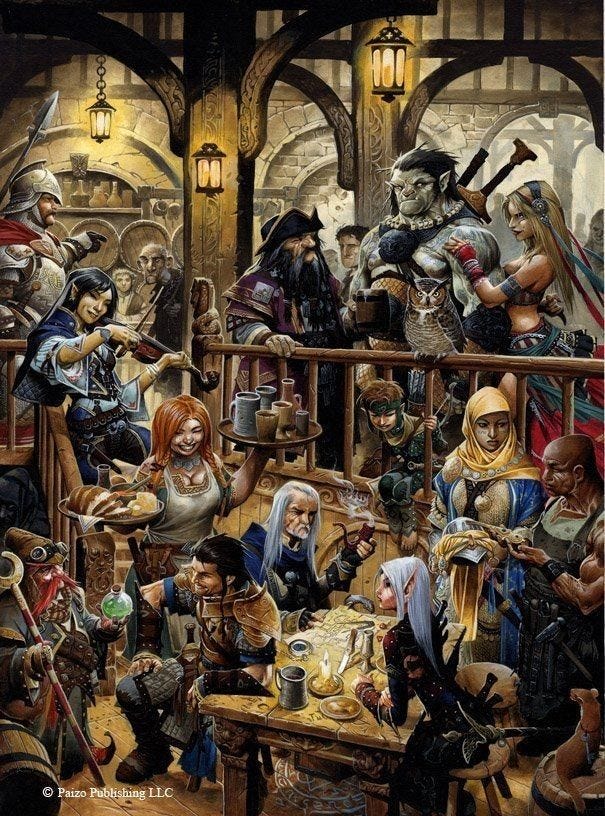
Most of you will be Jack’s total lack of surprise to learn that I played a lot of Dungeon & Dragons as a child, as a teenager, and yes, even as an adult. It would not be surprising if the same is true of many of you, as well. For those of you whose formative years were spent doing more wholesome activities that took you out of your basement, such as playing sports or talking to girls, all you really need to know to understand this post is that D&D offers players a selection of different races – elves, dwarves, halflings, orcs, and so on – each of which comes with certain advantages and disadvantages relative to the standard baseline human, in particular as regards the six numerical attributes (three physical and three mental) with which D&D parameterizes human ability:
Strength (STR): the amount of brute physical force one can exert
Dexterity (DEX): agility, grace, reaction time, hand-eye coordination, and fine motor skills
Constitution (CON): endurance; resistance to illness, infection, or poison; ability to absorb damage; rate of recovery from injury
Intelligence (INT): the power of one’s rational intellect, the extent of working and long-term memory, the rate at which one can learn
Charisma (CHA): sexual allure, charm, wit, extroversion, social intelligence
Wisdom (WIS): enlightenment, common sense, judgment, guile, willpower, and intuition
With the exception of strength and intelligence, which are fairly straightforward, each of these abilities bundles together a variety of related but distinct qualities which, in the real world, may not necessarily correlate. Charisma, for example, mixes together physical attractiveness with general social skills; in principle, there are certainly people who are beautiful but charmless, and people who are beguiling but visually repellent, but it is also true that in practice beautiful people obtain a sort of halo that blesses their social interactions. Overall the system does a reasonably good job of reducing the myriad dimensions of human variation onto six principle components that capture essential differences between individual human capabilities in the most important spheres of activity.
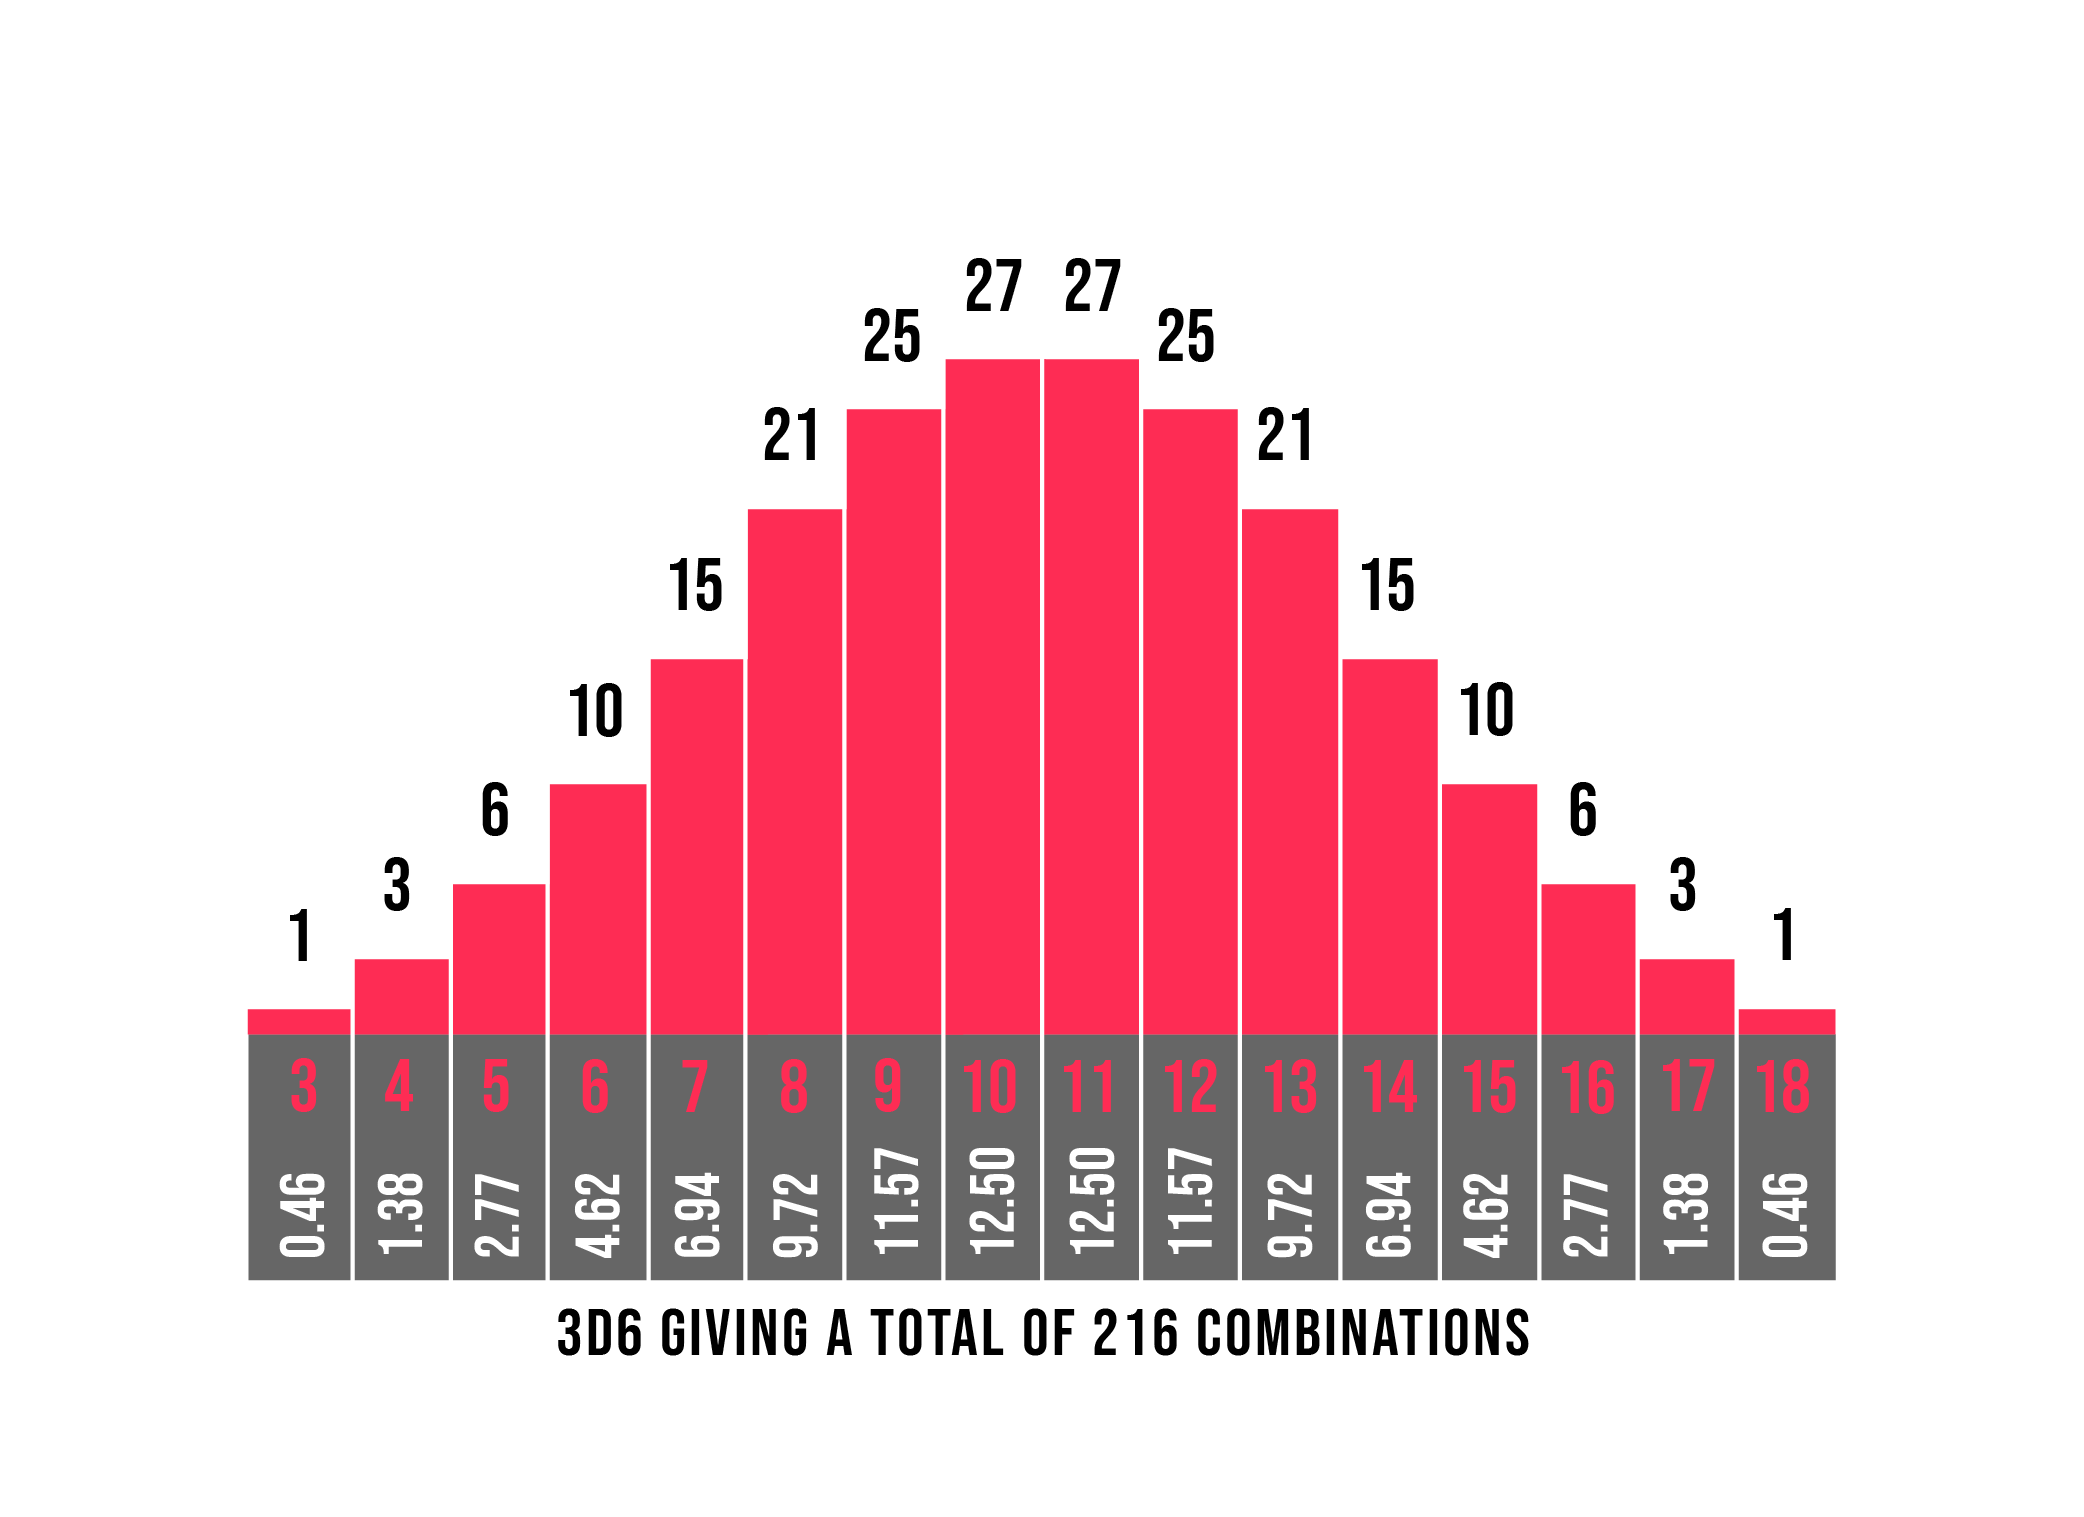
During the character generation process that precedes every D&D campaign, the six abilities are determined by rolling 3d6, meaning 3 six-sided dice. This results in a nice, albeit low-resolution approximation of a Gaussian or bell curve distribution, with a mean value of 10.5, extrema of 3 and 18, and a standard deviation of almost exactly 31. That is, about 67% of dice rolls will be within 3 of the mean value of 10.5, 95% will be within 6, and 100% will be within 9 ... which is actually beyond the limits of the dice.
If we consider IQ, which is well-known to follow a Gaussian distribution, the mean human IQ of 100 would correspond to an INT of 10 or 11 (fractional values are not allowed in D&D ability scores). The standard deviation in IQ is about 15 points, so 67% of the population have an IQ between 85 and 115 (stupid to clever), 95% are between 70 and 130 (functionally retarded to highly intelligent), and 99.7% of the population fall between 55 and 145 (severe retardation up to certified genius). In the D&D system these intervals would correspond to INT scores of between about 7 and 14, 4 and 17, and 3 and 182.
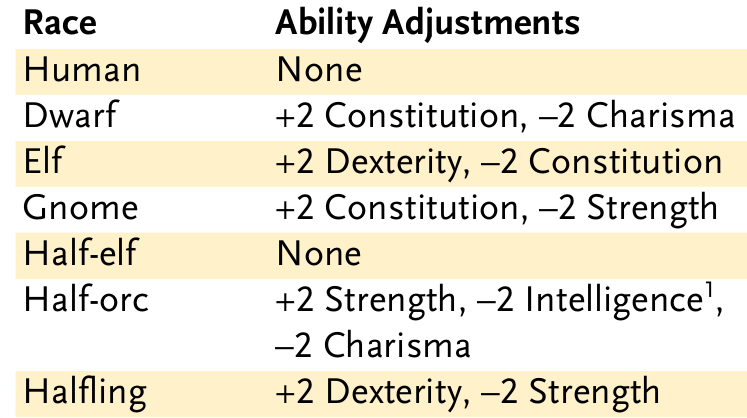
The fantasy races in D&D all come with modifiers to some of their attributes, due to psychological and physical differences between baseline humans (whose scores are unmodified) and their demihuman kin3. For example, elves are agile but frail, therefore receiving a +2 DEX but a -2 CON; dwarves are tough but gruff, with a +2 CON but a -2 CHA; half-orcs are strong, but stupid and ugly, receiving +2 STR but -2 INT and -2 CHA. The 3rd edition Player’s Handbook didn’t let you play a full orc, however we can get their modifiers from the Monster’s Manual, where we see that they receive +4 STR. -2 INT, -2 CHA, and -2 WIS. Those are the 3rd edition rules; in the 2nd edition, the combinations of advantages and disadvantages are the same, but the modifiers are smaller, ±1 in all cases, rather than ±2.
The racial ability modifiers in D&D therefore map to between 1/3 of a standard deviation (2nd edition) and 2/3 (in 3rd edition), i.e. the -2 INT modifier of half-orcs and orcs would correspond to a 10-point disadvantage in IQ as compared to the other races (none of whom have any modifier to their intelligence).
The ‘races’ in D&D are really better thought of as a mix of sub-species and species4. The only hybrids mentioned explicitly in the rules are half-elves and half-orcs, both of which are also half-humans. The Dark Sun setting contains the mul, a half-dwarf/half-human hybrid, which is sterile, implying considerable genetic distance between humans and dwarves, in fact greater than the genetic distance between humans and either elves or orcs, as both half-elves and half-orcs are apparently fertile. That there is a greater difference between humans and dwarves than there is between humans and orcs is ... interesting, when you think about it. Regarding crosses between the other races, there is no mention, from which it can be inferred that such hybrids are de facto impossible. This implies that the races should be thought of as branches from a human baseline, with the majority of them being incapable of interbreeding with either humans or one another (i.e. being entirely distinct species), and only the elves, dwarves, and orcs remaining close enough to breed with humans (but not close enough to breed with one another).
In the standard D&D setting, what we usually think of as ‘race’ when applied to humans – i.e. Caucasian, Sub-Saharan African, East Asian, and so on – does not imply any ability modifier, making the choice of a character’s ethnic background an almost purely aesthetic consideration. The same is true of a character’s sex, which leads to absurdities such as male and female characters having exactly the same range of STR scores. Nonetheless, if we consider the array of basic attributes described above, the statistical properties of the 3d6 distribution, and make the generally reasonable assumption that human variation can be approximated by a Gaussian distribution that can be easily mapped to the 3d6 system, we can ask the question: based on the scientific study of human biodiversity (or HBD) as regards anatomical, intellectual, and behavioural differences between continental ancestry groups, what ability modifiers, if any, should apply?
You might ask why anyone would want to do something this autistic, and that is a very good question, to which there are a few answers. The first, and most personally compelling, is that it I found it amusing. The second, which may be more compelling to the reader, is that it struck me that the D&D system is actually an excellent way to present a relatively holistic exploration of HBD.
HBD is, to put it delicately, a contentious topic, particularly when it comes to factors such as IQ. IQ has received by far the greatest degree of attention in the research of and discourse surrounding HBD, because it is by far the most important single factor in economic success, and thus group differences in IQ present an uncomfortable challenge to the narrative, central to the political project of race communism, that all disparities in outcome between racial groups in racially diverse countries, as well as disparities between racially distinct countries, can only ever be explained by racist bigotry manifesting as discrimination, xenophobia, or colonial exploitation.
However, HBD draws together a much wider array of subjects than intelligence. It includes everything from disparate susceptibilities to different diseases, behavioural proclivities (e.g., crime rates), personality traits (e.g. extroversion), and obvious physical traits (e.g. the greater African fraction of fast twitch muscle tissue, giving them a well-known advantage in running sports; the superior ability of Incans or Himalayans to metabolize oxygen at high altitudes, giving them a distinct home-turf advantage in any physical activity requiring endurance). By attempting to determine the modifiers for human racial groups across all six of the D&D abilities, we must consider human variation across multiple dimensions and boil it down to six numbers, thereby summarizing this variety into a compact and easily digested format.
Remember, we are only doing this for fun. Don’t take any of this too seriously.
Methodology
To make numerical comparisons it is first necessary to define a baseline. Rather than arbitrarily selecting a given race as the standard, unmodified human, we will instead generate an entirely fictive average human stripped of any identifying racial traits. The easiest way to do this would be to simply average over the global population, but this would result in too much weight being given to the most populous groups. Instead, the properties of this average human will be determined from a mean-of-means: first, the average ability of each racial group will be determined, and then the average baseline human’s ability level will be determined from the averages of these individual racial averages. For example, to determine the strength of the baseline human, we first determine the strength of the average Caucasian, the average African, the average East Asian, and so on, and then take the average of those averages.
Because sexual differences are often at least as important as racial differences, we shall consider males and females separately, for each each group, effectively treating the sexes as different races; our baseline human will therefore be not only a racially neutral mix, but wholly androgynous.
To determine the ability modifier, we need to know two things in addition to the ability level of the baseline androgyne: the standard deviation of the trait across all groups, and the degree of difference between the average ability of a given race and the baseline ability level. The standard deviation is easily determined. We then take the difference between the ability level of a given group and the ability level of the baseline human, and divide this by the standard deviation. Formally this is known as a z-score. As an example, if the baseline strength is 11, the standard deviation of strength across all races is 3, and the average strength of a given race is 12, then its z-score is simply (12 – 11) / 3 = 1/3; to convert this into the standard deviation of a 3d6 roll, we then simply multiply the z-score by 3, i.e. the strength modifier of that race is +1.
Because I am lazy, and the tool is available, to save a whole lot of time I’ve used AI – specifically, Grok, which is a lot less prone to politically correct guardrails than its lobotomized kin tend to be – to help speed up the analysis. None of the text in this article came from the AI. Grok was used only to data-mine the available research, and do the first-pass number-crunching. That should be considered a massive caveat regarding the reliability of the results, as AIs will frequently make mathematical mistakes. In some cases I substituted my own judgment for the AI’s, for reasons that I will explain as it becomes relevant. I spent quite a bit of time interrogating the AI, particularly when a group exhibited a notable outlier ability score. Because language models are known to be terrible at math, I double-checked the calculations, and made my own spreadsheet with which to calculate the final z-scores. In some cases this made a considerable difference, e.g. Grok initially assigned a ridiculously high z-score of 3 (a +9 modifier!) to the strength of white men due to the use of the wrong standard deviation.

The coarseness of the racial categories I’ve adopted is another significant limitation. I’ve largely chosen to examine the attributes of large continental ancestry groups, with the addition of a few other well-studied populations, for the simple reason that data on other groups is not usually very thorough. The races examined are: whites, blacks, Arabs, South Asians, East Asians, Native Americans, Ashkenazis, and Australian Aboriginals. Ashkenazis were considered separately from whites because they are a fairly well-studied sub-group of interest to many people, while Aboriginals were included because they are perhaps the most genetically distinct human population on the planet. I forgot to include Polynesians. Sorry about that.
Obviously, within each of these groups there is considerable variation. For example, ‘black’ would formally include the distinct populations of Bantu, Ethiopian, Pygmie, Congolese, and Khoisan, all of which have quite divergent traits, e.g. a pygmie can hardly be expected to be as strong and robust as a Bantu. Similarly in East Asia, there are considerable physical differences between Mongolians and, say, the Thai – Mongolian men would have a very hard time passing for women – while there are notable intellectual differences between the Japanese, Chinese, and Koreans on the one hand, and the Filipinos on the other. This is to say nothing of the biological diversity of the European races. Such finer distinctions, which could in principle be pursued to an almost infinite level of ethnic detail if the data were available (it largely isn’t), should be kept in mind when considering the racial ability modifiers inferred below. Indeed, in many cases data were not available for some of the groups included here, and Grok more or less filled in the blanks by guessing. The most reliable results across all abilities are probably those for whites, blacks, and East Asians.
To initiate the analysis of each trait, I used the following prompt (modifying as appropriate):
Please gather together all available data which can be used to infer X, for example: studies of A; B; C; D; E; and anything else which is relevant. Using these data, infer the population averages and standard deviations for the following racial groups: whites, blacks, Arabs, Ashkenazi Jews, South Asians, East Asians, Native Americans, and Australian Aboriginals. For each group, provide male and female averages separately. Then use these individual racial averages to infer the X index of an average androgynous human (i.e. with equal contributions from each group), along with the standard deviation of this average specimen. Then, determine the difference, expressed in standard deviations, of the racial average of each group (again, for males and females separately) from this averaged human baseline.
In many cases, I expanded the datasets under examination as I went, asking the AI to provide suggestions for studies that could prove helpful. Whenever possible I tried to use quantifiable metrics, but I also included more qualitative evaluations, e.g. when examining charisma I considered it appropriate to include general beliefs regarding physical attractiveness and charm alongside studies of Big Five traits such as extroversion, together with prominence in the performing arts (charisma is, after all, an essential trait for bards). When considering such qualitative evaluations, Grok would spontaneously assign a best-guess numerical index to capture the variation. This probably seems arbitrary, and indeed in a sense is, but Grok actually seemed to do a pretty reasonable job of this; whenever I dug in, which I did repeatedly, Grok justified its choices well. It actually seems to be better at such qualitative analysis than it is at reading columnar data, which it frequently screws up. This is simultaneously funny and frightening.
An obvious critique of the inclusion of qualitative data is that it opens the results to being biased by stereotypes, potentially to the degree that the results reflect nothing but these stereotypes. To this it can be responded that stereotypes have been repeatedly demonstrated to be remarkably accurate – indeed, next to IQ, stereotype accuracy is one of the most replicated findings of the social sciences. It is an indicator of the corruption of those disciplines that both stereotypes and IQ are considered swear words by so many of its practitioners.
Another answer to the sterotype question is that the AI, being an AI, will if anything err on the side of political correctness due to the well-known liberal bias exhibited by large language models trained on textual data which has for decades been permeated by precisely this bias across the mainstream media, academia, and the government. By using the AI to perform this analysis, hopefully my own personal biases can be minimized, with the AI’s output primarily reflecting the (presumptively more accurate) group biases shared by the entire human species (at least that fraction of it which has contributed to its textual training data), mitigated by left-liberalism’s long-standing attempts to eliminate the expression of bias in the public sphere.
A further, and more interesting, objection to the use of qualitative cultural data such as e.g. contributions to the arts or historical military performance, is that this is, well, cultural, and we’re interested in biology. While on the surface the two are distinct traits, one being physical and the other largely intangible, at the root they are inseparably intertwined. Human culture emerges from human biology, and culture then establishes an environmental context that affects that biology at both the genotypic and phenotypic level. For example, dietary habits will directly affect physical size, strength, health, hormonal levels, and so on, while educational habits may affect intelligence, all of which constitute cultural modifications of phenotype. Over time, the fitness landscape established by a culture affects the genes that are passed on. The people born with these culturally modified phenomes and genomes then go on to modify the culture themselves, which in turn introduces further biological effects, and so on.
On the extreme there are some who hold that the study of human biodiversity is in practice nothing but the study of culture, but one does not need to hold to such cultural maximalism to admit that culture has a massive biological impact. However, for our purposes here it is actually quite irrelevant whether whatever differences we find have primarily cultural or primarily genetic origins. For instance, if one race is found to be systematically weaker than another race, it does not matter whether they are born that way, or whether their relative weakness arises from a low-protein diet and a lack of exercise; the biological fact of relative weakness in that population relative to others remains unchanged. The same argument applies to every other trait. That said, however, it is in my opinion absurd to insist on either cultural or genetic maximalism; both play a big role, and human biodiversity might be better thought of as human biocultural diversity, but HBD is the term that’s in use so we’re sticking with that.
In order to prevent the AI from getting locked into a single method of analysis, potentially polluting the results with assumptions from the previous steps, each ability was analyzed by initiating a fresh instance with a version of the prompt above. I was also concerned with keeping the AI from guessing what I was doing; the first time I tried this I had Grok do all of the stats at once explicitly in the context of D&D, which led to the stupid thing capping the modifiers at ±2 and trying to balance the modifiers such that they generally summed to zero, as with standard D&D. That first attempt resulted in an amusing Twitter thread (which I also expanded to the gypsies, neanderthals, and Yamnaya, just for fun); I’ve unrolled it for you here if you want to have a laugh. However, I wanted to see what the results would be if considered with a bit more depth and rigour, and without unduly biasing the AI with the conventions of a game which, after all, we want to use as an illustrative and flexible framework rather than a straightjacket.
I seriously considered putting everything that follows behind a paywall, because it’s more than a little spicy in places. Just saying these things out loud could get one in trouble in polite society. I can just see some Antifa jerk hate-reading this article, looking for quotes to take out of context and use against me later, should I ever – gods above forbid – be doxxed. Might as well make them cough up for the privilege, no?
But, instead, I listened to the angel of my better nature, and so I have, as I always have, put everything out for the whole world to see. Perhaps I shall regret that; perhaps many shall be offended; but I like to think that you, my dear reader, have the strength of personality to not be so easily put off by this half-serious attempt to quantify human differences in the context of a children’s game. Indeed, I hope that you will appreciate the amount of work that went into this whimsical little project, which indeed I spent many hours over many days working on. If you do appreciate it, there’s an easy way to let me know:
Ability Modifier Determination
Strength
For strength, I looked at grip strength, skeletal muscle mass, height, weight, and performance of elite athletes in powerlifting and weightlifting competitions (quantified by powerlifting totals, i.e. the total amount of weight lifted across the squat, bench press, and deadlift5).
There are abundant data for whites, blacks, and East and South Asians; data for the other groups were more limited. For powerlifting, where studies were not available, Grok used records set by individual powerlifters from relevant groups. Grok filled in some of the data for Native Americans using information available for Hispanics, which seemed sort-of reasonable since Hispanics have varying levels of Native American ancestry, ranging from ‘almost a hundred percent’ to ‘none at all’ (I actually ended up doing this a fair bit with Native Americans, which is worth keeping in mind). For Ashkenazis, Grok initially pleaded an absence of data and proclaimed them as similar to whites; however, this didn’t quite match the perception that they aren’t generally the most athletic people, and ignores genetic similarities to Arabs, so this part of the analysis was revisited using Israeli data (an imperfect proxy for Ashkenazi, since Israel contains a diverse population including large numbers of Sephardim as well as Arabs, but better than nothing; as with Native Americans and Hispanics, I ended up doing this quite a bit).
Grok boiled down the ‘strength index’ from the most easily quantifiable metrics: grip strength, skeletal muscle mass, and powerlifting totals, with the index calculated as (grip strength + skeletal muscle mass + powerlifting total / 20) / 3. The modifier of 20 was used simply to bring the magnitude of the powerlifting total within the same numerical range as grip strength and skeletal muscle mass. The results are summarized in Table 1.
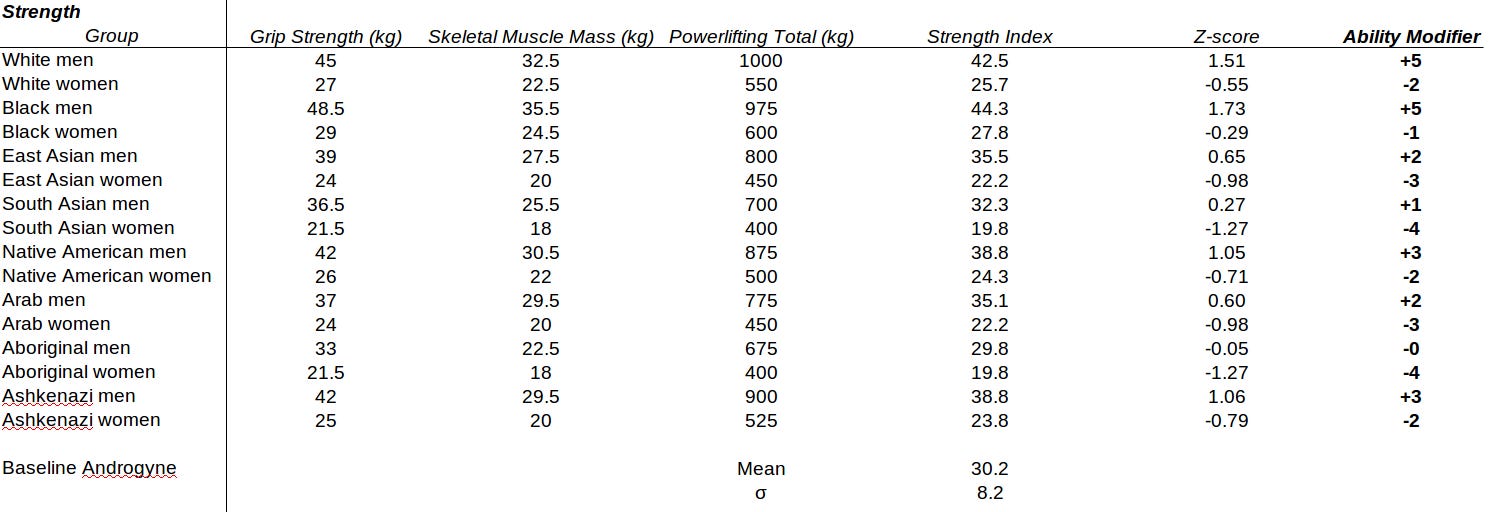
xThe first thing that we notice is that these ability modifiers are ridiculous overpowered with respect to those usually adopted in Dungeons & Dragons. The strongest playable D&D race is the half-orc, with STR +2. Relative to the androgynous human average, white and black males are, by comparison, an incredible +5, absolutely mogging every other group. Of course, the reason for this is that we are considering not only the differences between races, but the differences between the sexes, and the sexual difference in upper body strength is considerable. While white men have STR +5, white women have a -2 modifier; comparable differences are seen between the sexes across other racial groups. South Asian and Aboriginal women have STR -4, the lowest in the set; formally, this would mean that they could potentially have negative strength in a 3d6 system (in practice, the DM would simply limit the lowest possible ability level to a 1). Comparing only men to men, the largest differential (5 points) is between white and black men and Aboriginal men, who have no modifier (actually a very slight negative z-score, which rounds to 0).
It’s interesting to note that black men actually have more skeletal mass, and somewhat higher grip strength, than white men, but white men have higher powerlifting totals. It is generally recognized that white men dominate global powerlifting competitions, in part because whites tend to have more upper body strength than other races, and in part because bodybuilding is the white man’s yoga. So why don’t blacks beat whites in powerlifting, despite they’re higher muscle mass? If I had to guess, this is partly due to blacks having a higher fraction of fast-twitch muscle tissue – important for explosive movements, less important for strength – and partly for simple cultural reasons. It’s also worth pointing out that the z-score of black men is actually higher than that of whites; both simply round to the same number.
In the D&D combat system, a character’s strength modifies the amount of damage they can inflict, with values above the average giving a positive damage modifier and values below the average giving a negative modifier. Women who have seen too many Marvel movies, in which 140-pound ballerinas axe-kick rooms full of linebackers through plate glass windows using girlboss-jitsu, may want to consider the implications of these massive sexual differences in upper body strength.
To make this more concrete in game terms, the average white man here would have STR 15 or 16, corresponding to a +2 or +3 damage modifier; the average white woman would have STR 8 or 9, a -1 modifier. The damage from a punch is determined from a 1d2 roll, basically a coin-flip; thus, the average white woman is equally likely to inflict 1 hit point of damage, or do no damage whatsoever, whereas the average white man could inflict between 3 and 5 hit points just with his fist. A 1st-level character might only have around 4 hit points; thus, while it is entirely possible for the average woman to fail to so much as bruise a male assailant, it is entirely possible for the average man to one-shot a relatively frail woman with a single solid punch. This is not so different from reality, and it is why women’s single best self-defence move is not to try to emulate Black Widow, but to run as fast as their legs can carry them, or to carry a gun.
Dexterity
In this case I told Grok to consider: studies of reaction time; hand-eye coordination; fine motor skills; elite performance in sports such as gymnastics and martial arts; elite performance in sports requiring high degrees of hand-eye coordination, such as cricket, baseball, basketball; elite performance in sports requiring a high degree of precision, such as marksmanship, archery, or other ranged weapons; and historical performance in military engagements in which ranged weapons played a major role.
Grok boiled this down to a consideration of four major factors: reaction time, hand-eye coordination, fine motor skills, and elite performance. Each of these was then normalized to a 100-point scale, with 50 as the average, and this was then used to develop a standardized dexterity index as the simple average of the four parameters. The results are summarized in Table 2.

The only directly quantifiable metric in Table 2 is reaction time6. Reaction time data is only available for a few races (whites, East Asians, blacks); in other cases it seems that Grok was filling in the blanks with IQ comparisons (there’s a known correlation, indeed this is the point of the Richard Lynn study on racial variations in reaction time that Grok was drawing from), or assuming similar values for similar races.
The remaining three categories were assigned numerical values heuristically, based on comparisons of performance across various sports requiring high degrees of finesse or hand-eye coordination (marksmanship, archery, table tennis), or cultural practices involving fine motor skills (e.g., calligraphy, watchmaking). I interrogated the AI a fair bit on these more qualitative issues, in order to satisfy myself that it wasn’t being unjustifiably biased. On fine motor skills, for example, the AI pointed out that calligraphy was a widespread practice in the Orient, to a degree that watchmaking wasn’t in Europe, which it used to argue that East Asians probably have somewhat better fine motor skills than whites; however, when it came to the use of ranged weapons, it judged that the record of marksmanship across the two groups was essentially comparable, given e.g. Olympic gold medals, historical military data, and so on.
Dexterity exhibits a similar range of variability as strength: from +6 for East Asian males (this is actually the highest modifier in the entire set) to -5 for Ashkenazi women. It should be noted that there was (according to Grok) no specific reaction time data for Ashkenazim, including when checking Israeli data. However, the low dexterity assigned to Ashkenazis, and the high value assigned East Asians, does tend to fit the general stereotypes that East Asians are quite nimble, while Jews tend to be a bit klutzy, perform poorly in athletics, have low visuospatial intelligence, and so on.
Sexual differences in dexterity are not as pronounced as they are in strength. Males still have the advantage, but usually only by 2 points or so. This fits with general impressions that men’s reflexes tend be faster in fights or sporting situations.
Constitution
For constitution, I had Grok consider studies of susceptibility to an array of infectious diseases; studies of the rate of recovery from injury or surgery; performance in endurance sports, in particular marathon running; and susceptibility to congenital diseases, e.g. due to inbreeding.
Initially Grok tried to base the disease metric entirely on COVID infection rates, so I went back and told it to broaden its consideration of diseases considerably.
Numerical calculations using marathon times were straightforward7. Grok mapped the other three quantities used to calculate the constitution index – infection susceptibility, injury recovery, and congenital disease – to three different scales. An infection susceptibility (IS) of 1 is the baseline; higher numbers indicate a higher susceptibility. The baseline for injury recovery (IR) was set to 0, with lower numbers indicating a longer recovery time, and higher numbers, faster recovery. A congenital disease (CD) risk of 1 is the baseline level, with values higher than 1 indicating a higher risk. It then calculated the constitution index as 100 – (IS – 1) x 25 + IR x 25 + [(130 min – marathon time) x 25]/(130 min) – (CD – 1) x 25. Grok assumed the average marathon time was 130 minutes; the actual average (which I substituted) was 140 minutes. The results are summarized in Table 3.
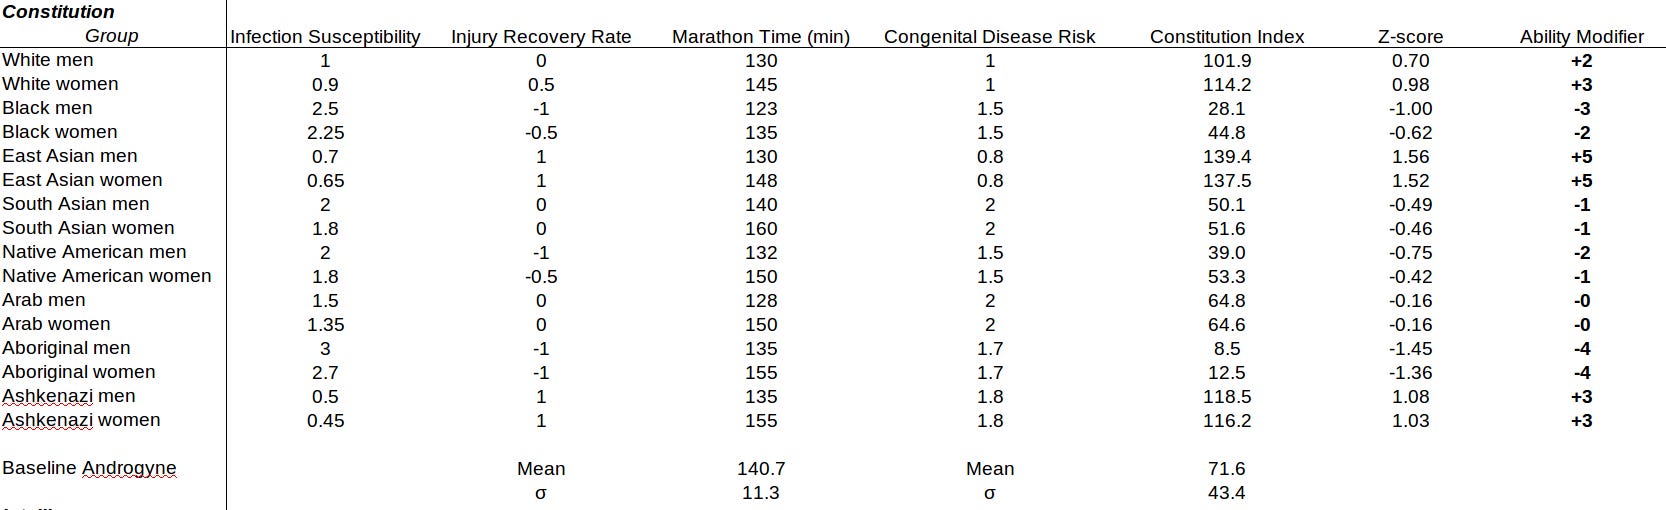
The racial range of variation of constitution is as wide as strength and dexterity. The toughest people are apparently the East Asians (+5), followed by (somewhat surprisingly) the Ashkenazim (+3), whose relatively poor endurance and high rate of congenital defects are apparently more than compensated for by their rapid rate of injury recovery and strong immune systems. The only other group with a positive modifier are whites. South Asians (diabetes, fatty liver), Native Americans (weak immune systems, susceptibility to drugs and alcohol), and Aboriginals (same problems as Native Americans) all take a hit; apparently they are not terribly robust people. Blacks, despite excellent performance in endurance sports, get absolutely hammered in the other categories (injury recovery, susceptibility to infection), which drags them way down. This rather fits the stereotype that blacks are physically strong, but have somewhat fragile health. Arabs, despite the high rate of congenital disease due to inbreeding, apparently have good endurance, and therefore receive no modifier (actually a slightly negative z-score, rounded to 0).
Sexual dimorphism is almost completely (but not quite) absent from constitution, in rather stark contrast to strength and dexterity. The range of racial variability, however, is as significant as it is in strength and dexterity (9 points, in this case).
I explicitly did not consider life expectancy, as in a D&D setting the longest-lived race (elves, who live for a thousand years or more) are also the most frail (CON -2). Just because you have a long life expectancy doesn’t mean you’re actually all that tough. Nevertheless, the constitution ability modifiers that emerge from these other considerations do correlate quite well to life expectancy: Ashkenazim and East Asians are quite long-lived, whites about in the middle, while blacks and Aboriginals have the shortest life expectancies.
Intelligence

For such a complex trait, intelligence is by far the easiest to evaluate, since we can rely entirely on IQ, which has been studied exhaustively. The results in Table 4 will probably not be surprising to anyone even passingly familiar with the enormous literature on this subject.
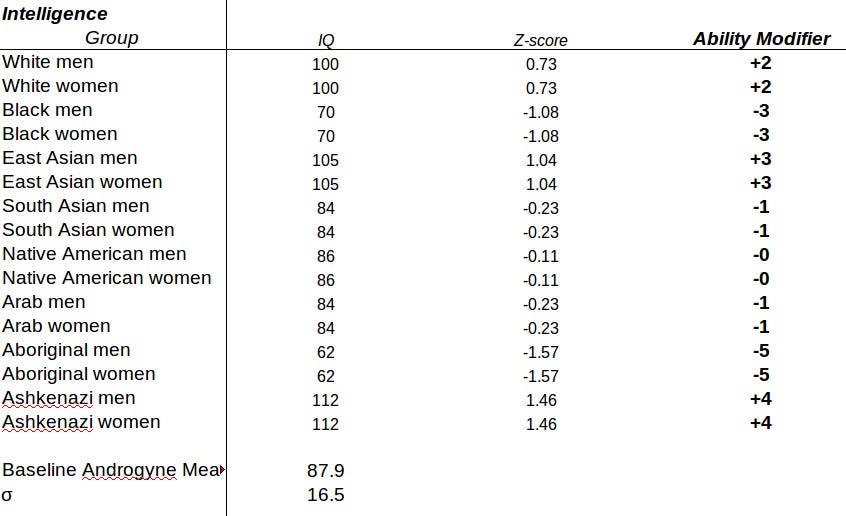
A couple of caveats are worth mentioning. First, the African average (70) was used in preference to the average for American blacks (85), as the latter have a degree of Caucasian admixture that likely brings up their score; however by the same token, Africans tend to suffer from a higher disease load and poorer nutrition, which may well artificially depress their IQ. Nevertheless, 70 is apparently more reflective of the global African population as a whole.
Second, the Ashkenazi average IQ of 112, famously the highest group average in the world, is widely accepted but is also rather contentious, with critics pointing to the poor quality of many of the studies this number relies upon (e.g. small sample sizes, high degrees of selection bias, and so on), and suggesting that the true average is several points lower. If a lower value – say 107, which I’ve seen suggested – is adopted instead, this doesn’t actually change the final modifier, because the overall variance of the population from which the modifier is calculated is reduced. Of course, the most extreme critics of these studies insist that there is no Ashkenazi advantage in intelligence whatsoever; if we make this change, and also raise the black IQ to the African-American average, the change in variance results in a -1 penalty for blacks (but a -6 for Aboriginals!), a +3 for whites and Ashkenazi, and a +4 for East Asians.
It’s worth emphasizing that the intelligence modifiers calculated from the z-scores do not assume a difference from an IQ of 100, which is technically the definition of the mean in IQ; nor do they assume a standard deviation in IQ of 15. Instead, the calculations used the IQ of the baseline androgyne (87.9, the average human is apparently a bit dullwitted) and the standard deviation across the groups (16.5, a bit larger than the number usually adopted for standard deviation in IQ). Using an average IQ of 100 as the comparison number would shift all of the modifiers in the same direction, e.g. whites are now INT +0 but blacks are -5; using 15 as the standard deviation would slightly increase the magnitude of the modifiers, e.g. blacks would then be INT -6.
Intelligence exhibits as much racial variability as do the physical traits. However, there is no sexual dimorphism apparent here. This might not be entirely accurate. There’s some evidence for greater male variability, with women having a slightly higher average IQ but the male population demonstrating more variance, such that men are both more likely to be extremely stupid and extremely intelligent. This is difficult to account for with a simple numerical modifier. A house rule that could account for this might be to include an additional role of 1d2 (i.e. the result of a 6-sided die, divided by 3) to the 3d6 roll for INT for male characters, adding the 1d2 result if the 3d6 INT score is 11 or greater, and subtracting it if INT is 10 or below.
Charisma
Charisma is an intrinsically difficult thing to quantify, given that it’s an extremely subjective quality, and that it bundles together a large number of different attributes that add up in complex ways. To try to get a handle on this, I had Grok draw together whatever data it could find on: studies on the Big Five personality traits of openness, agreeableness, and extroversion; studies from dating sites on response rates between different groups; studies of facial symmetry or other objective markers of beauty; studies of performance in leadership roles; elite performance in entertainment, e.g. acting, stand-up comedy, music; historical stereotypes and contemporary popular sentiment considering the overall level of charm, persuasiveness, and physical attractiveness.
Grok reduced these data to four parameters: Physical Attractiveness, Social Persuasiveness, Cultural Appeal, and Elite Performance, each of which was rated on a 100-point scale with 50 as baseline, from which it derived a charisma index. Once again, I had Grok substitute data for Hispanics in for Native American; the results otherwise were quite unflattering, I think a bit unfairly.
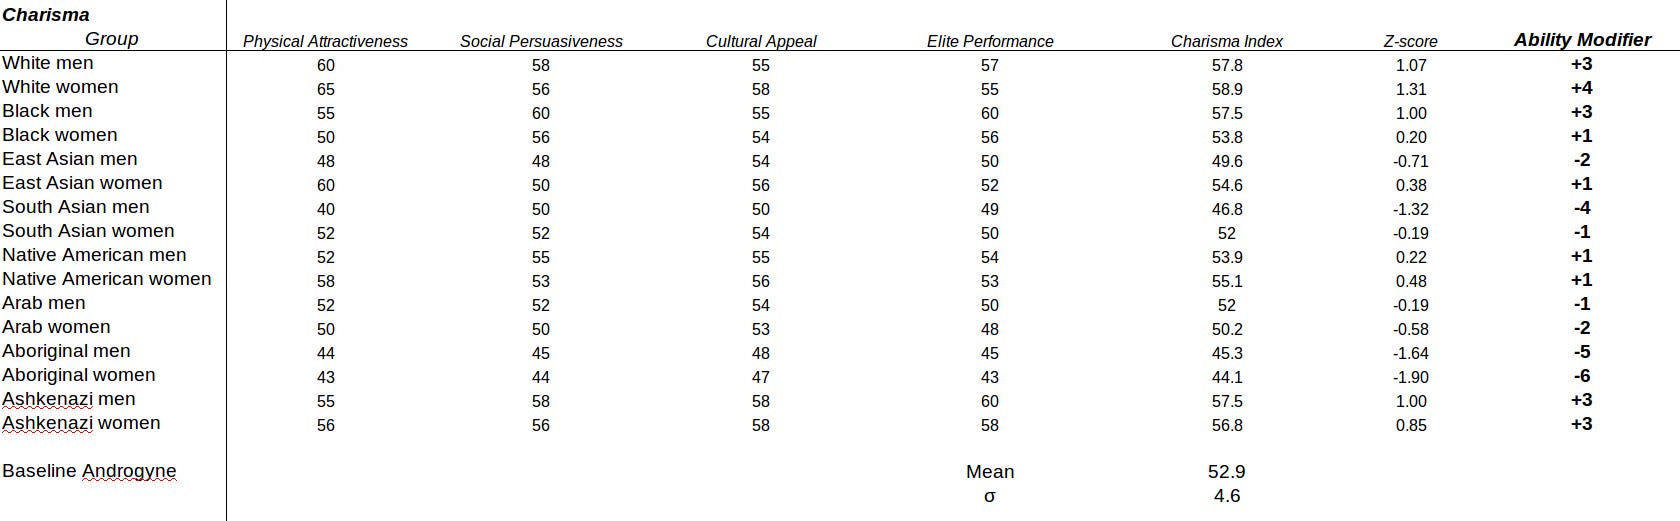
The overall results aren’t surprising. The winners are black men (mainly thanks to their strengths in the performing arts), white men and white women (who get a big attractiveness boost from the dating site data), and Ashkenazim (who outperform in verbal wit). The losers are Aboriginals and South Asian men.
As with the previous scores, the overall spread in modifiers is 10 points. This time the largest difference is between white women, the winners of the charisma game, and Aboriginal women, its clear losers. Memes have been made about this specific difference.
While the data used to assess the component scores was fairly subjective, the results seem to approximately line up with expectations. White women, with the highest charisma modifier, would be expected to mate with men with comparable scores: in this case, white men, Jewish men, and black men. They’d be expected to spurn men with much lower scores, e.g. East and South Asian men. They’d also be expected to receive the most attention on dating sites. This is exactly the pattern that we see. It’s also notable that East and South Asian women have significantly higher charisma modifiers than their respective men, which matches stereotypes; the same is true of white women and white men, though the difference is less stark (again, matching stereotypes). Interestingly, this trend is reversed for black men, who have higher charisma scores than black women, which is also consistent with general perceptions.

Wisdom
Wisdom seems like something which should be surpassingly difficult to quantify, so a bit more thought went into this question than the others. The AD&D Player’s Handbook states that it is a combination of willpower, practical intelligence, sensory acuity, and intuition, which actually provides a lot to go on since, as it turns out, many of these factors are amenable to various forms of psychometric testing.
After some fine-tuning, I had Grok gather information on the following: studies on willpower; studies on time preference and deferred gratification; studies on sensory acuity or perceptiveness; studies on situational judgment tests; studies on tacit knowledge; studies on the rational-experiential inventory; studies on Myers-Briggs intuition scores; studies on relevant Big Five personality traits, in particular conscientiousness and neuroticism; studies on emotional intelligence, empathy scales, and perspective-taking; HEXACO8 studies examining conscientiousness and honesty-humility; studies on criminality, such as offence rates, arrest rates, and recidivism rates; the rate of contributions to creative fields requiring high levels of intuitive insight, such as philosophy, literature, or poetry.
Grok boiled these down to a four-factor system: willpower, practical intelligence, sensory acuity, and intuition, each of which was rated on a 100-point scale based on relevant contributing factors from the above-mentioned datasets. The wisdom index was then just the straight average of these. The results are shown in Table 6.
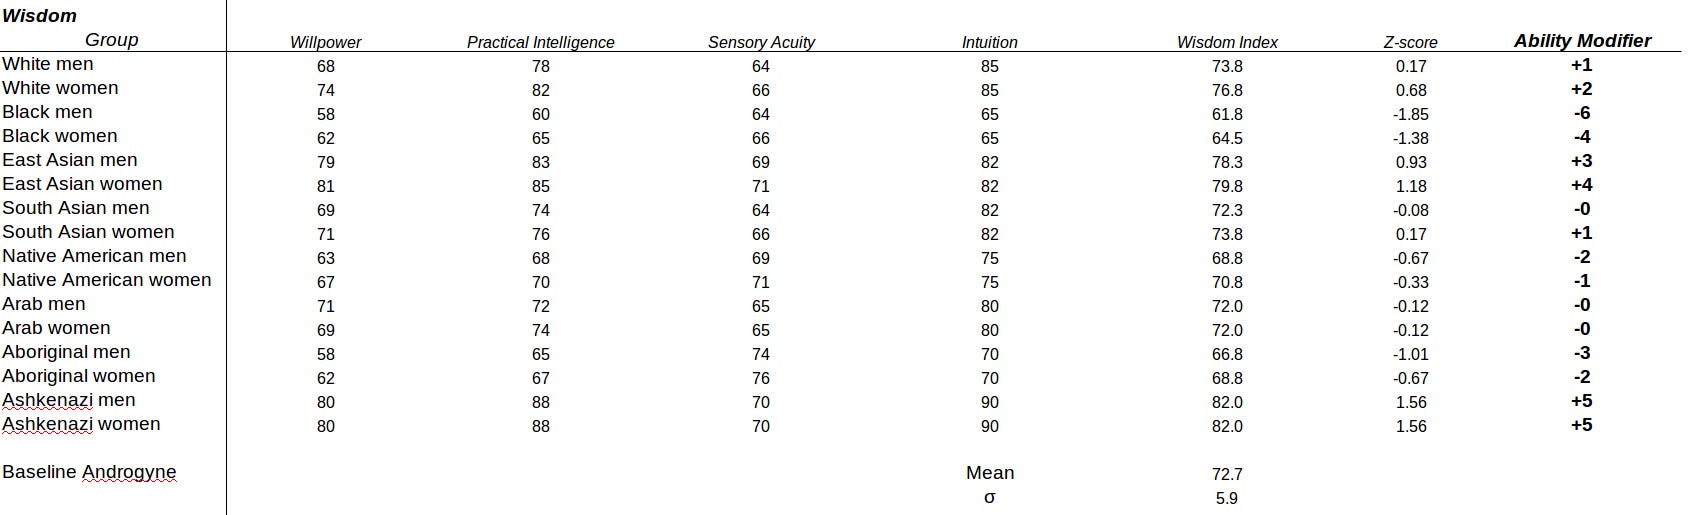
Ashkenazis absolutely dominate, with a WIS +5 modifier. Next in order are East Asians and whites, respectively, with women having a slight edge over men in both cases, largely due to the higher levels of criminality exhibited by men. Blacks are the lowest of all, with black men having WIS -6.
In D&D the wisdom score is particularly important for druids, clerics, rangers, and the like. The mystic may not be a man of great learning or intellect, but he has an uncanny ability to know when to act (and when not to act), and how. It’s often associated with street smarts or oneness with nature: the canny rogue or the simple peasant may not be particularly intelligent, but they have excellent instincts, which make them survivors. Insofar as this mental image goes one might criticize the wisdom modifiers for unjustly penalizing blacks, Native Americans, or Aborigines – in their natural environment, after all, they can have very good instincts. The data, however, point to severe problems in these groups with petty or violent crime, drug abuse, poor financial decisions, and the like, which is what generally drags them down. To a certain degree this an intelligence problem, but common sense isn’t just about intellect. This also subverts the image of the wise Native American elder at one with the ways of nature; but then, it was Europeans, and not the Native Americans, who invented the wildlife preserve.
The inclusion of crime statistics in evaluating the wisdom modifier might be criticized on the grounds that groups with higher IQs – Ashkenazim or East Asians, for example – are much less likely to engage in street crime, but are far more likely to engage in white collar crimes, such as stock market manipulation, embezzlement, Ponzi schemes, and other forms of non-violent corruption. The point, however, isn’t so much that committing crime itself is unwise: it is rather that it is unwise to commit the kind of low-value crime that is likely to get one caught.
Summary
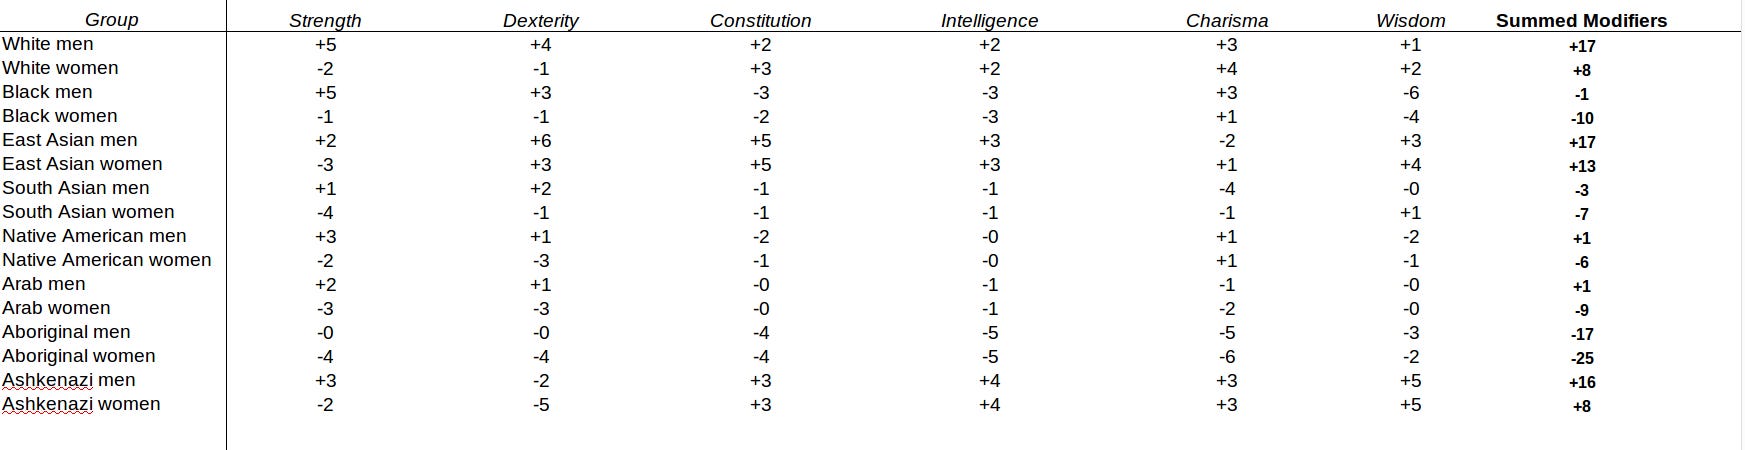
The ability modifiers derived above are summarized in Table 6, but since looking at columnar data isn’t all that much fun I also provided a summary data visualization9 so that you can take it all in at once.
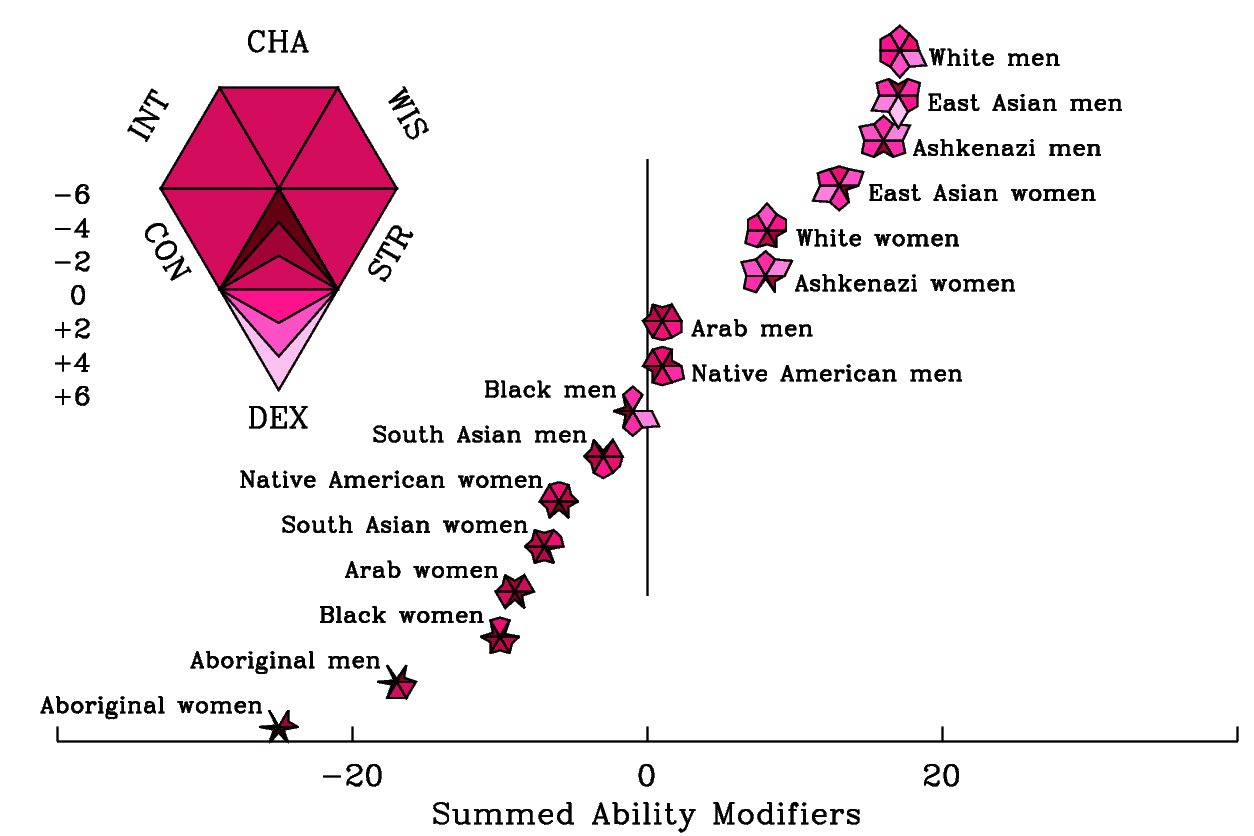
Without putting too fine a point on it, the rank order in the summary figure bears a remarkable resemblance to the inverse of the progressive stack.
Several things are worth commenting on.
First, there is the sheer magnitude of these ability modifiers. The racial modifiers assigned for the fantasy races in AD&D are generally ±2. Here, by contrast, we see modifiers of ±6. An orc, as mentioned in the introduction, has STR +4, which is considered such a stark advantage on the battlefield that it must be balanced by -2 modifiers in all three mental attributes in order to keep things fair for the good guys. This difference in strength is comparable to the difference here between white and black men on the one hand, and South Asian men on the other: physically, whites and blacks are to South Asians as orcs are to humans.
The discrepancy between the fantasy world and the real world is even more dramatic when it comes to intelligence: an Orc is penalized with a mere INT -2, whereas an African man receives INT -3 ... with a 5-point difference with whites, a 6-point difference with East Asians, and a 7-point difference with Ashkenazim. The difference with Aboriginals (INT -5) is even more extreme. Spreads of this degree are practically unheard of in D&D.
The second thing to take note of is that the ability modifiers are unbalanced to an almost comical degree. In D&D the modifiers for a given race usually sum to 0, e.g. an elf gets DEX +2 but CON -2, a dwarf CON +2 but CHA -2, and so on. This is done to keep game-play interesting. No one will want to play a race with nothing but negatives dragging his character’s ability scores down; everyone will flock to races with nothing but positives boosting their scores to superhuman levels. HBD&D, however, was not designed in a game studio, it was not play-tested, and it does not care in the slightest about fairness. As can be seen in the data visualization (and in Table 6), summed ability modifiers range from +17 for white men and East Asian men (with Ashkenazi men coming a close second at +16), to a frightening -26 for Aboriginal women. Even more unfairly, white men end up, uniquely, with positive modifiers to every single ability; conversely, Aboriginal men10 and women have negative modifiers to every ability.
To return to the comparison of whites to South Asians, imagine going up against orcs in battle, only instead of the orcs being stupid, ugly, and foolhardly, they’re highly intelligent (indeed smarter than you are), better-looking and more charming than you are, and as cunning as foxes. It doesn’t seem fair because it isn’t.
If you were looking at this rule book and deciding on your character, you’d almost certainly demand to play as a white, East Asian, or Ashkenazi man. If the Dungeon-Master forced you to play instead as, say, a black woman, while letting his buddy play as a white man, you’d probably be furious. You’d want to kick the table over. You’d want to stop playing, or you’d want to change the rules of the game entirely. Which probably goes a long way towards explaining the emotional currents twisting through our globalized, multiracial societies. On the other hand hand, if you looked at that summary figure, and were asked in absence of any other information to guess which groups would carve up the world, and which groups would be subjugated as it was carved up, it’s pretty obvious which way you’d bet, and that goes a long way towards explaining the current global distribution of land and power.
However, it’s clearly not so simple as ‘white man on top’ in the modern era. While white men are the only group with bonuses in all ability scores, they have a relative weakness in wisdom – lower than white women, East Asians, and Ashkenazis. In the D&D system wisdom is what protects your character from enchantments, particularly spells such as charm which bend your character’s will to another’s. A race disadvantaged in wisdom is vulnerable to being enthralled by dark witchcraft, used for ends not its own, even used against itself. Fortunately for white people, there’s no such thing as black magic, and they’ve certainly never been ensorcelled to work against their own interests.
Thank you very much for your precious attention. I hope you’ve found this as entertaining to read as I did to write. As always, my deepest gratitude towards my patrons: your aristocratic generosity makes it possible for me to spend my time informing, amusing, and entertaining you, and it is my deepest hope that you found this little diversion to be informing, amusing, and entertaining. If you didn’t, I suppose you’ll let me have it in the comments...
Technically, 2.958.
Technically, the final interval should be 1 to 20, but the limits of the dice rolls are 3 and 18. Formally in D&D, an INT score of 1 is a non-sentient organism such as a plant, which is actually quite a bit lower than an IQ of 55. Higher scores than 18 are possible with modifiers; indeed, there is no upper bound on ability scores.
I’m quite deliberately ignoring the abomination that Wizards of the Coast has created with the 5th edition, in which if I understand correctly there are no racial ability modifiers, with each character simply getting a set number of pluses and minuses to apply willy-nilly as they see fit. Racial ability modifiers are, you see, racist.
I believe that Wizards of the Coast removed the hateful term ‘race’ from the rulebooks, replacing it with ‘species’. ‘Race’ being racist, you understand.
The first time I ran the analysis, Grok tried using Sinclair coefficients for powerlifting totals, which normalize to weight class; I had to instruct it to use the actual totals, since we’re interested here in strength, not in the strength-to-weight ratio.
Which was converted to a 50-point scale with the formula 50 + 15 x (mean reaction time – reaction time) / 50.
Marathon data were not available for Native Americans (an Hispanic proxy was used), Ashkenazim (Israeli proxy), or Aboriginals (marathon times guessed based on their history as endurance hunters, but lack of any cultural practices involving long-distance running).
This is a personality test which I’d never heard of before. It stands for Honesty-humility, Emotionality, eXtroversion, Agreeableness, Conscientiousness, and Openness to experience.
I put a lot of work into that visualization. Like, several hours over a couple of days.
Technically the strength and dexterity of Aboriginal men are unmodified, however, this is due to rounding; the negatives in the table reflect that these abilities skew just below the median values for the baseline androgyne.
I love the way you identified our great weakness, at the end.
> However, it’s clearly not so simple as ‘white man on top’ in the modern era. While white men are the only group with bonuses in all ability scores, they have a relative weakness in wisdom – lower than white women, East Asians, and Ashkenazis. In the D&D system wisdom is what protects your character from enchantments, particularly spells such as charm which bend your character’s will to another’s. A race disadvantaged in wisdom is vulnerable to being enthralled by dark witchcraft, used for ends not its own, even used against itself. Fortunately for white people, there’s no such thing as black magic, and they’ve certainly never been ensorcelled to work against their own interests.
Yeah I don't think the original game designers were thinking too deeply about actual patterns of variation across species. Game balance was obviously of greater concern - you don't want any one race to be OP, or it breaks the game.